
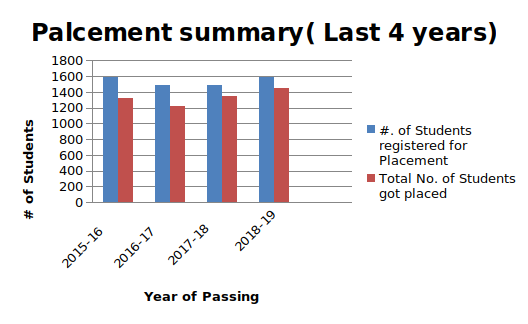
PLACEMENT SUMMARY (LAST 4 YEARS):
|
Description/Year |
2015-16 |
2016-17 |
2017-18 |
2018-19 |
|
#. of Students registered for Placement |
1589 |
1485 |
1492 |
1586 |
|
Total No. of Students got placed |
1318 |
1227 |
1355 |
1452 |
|
% of Placement |
82.95 |
82.63 |
90.81 |
91.55 |
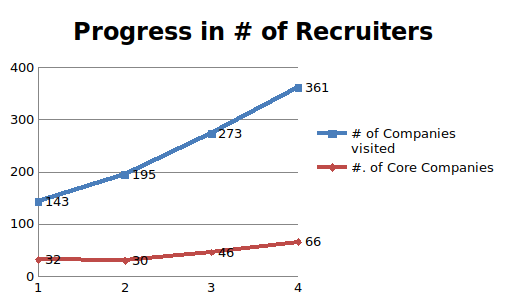
STEADY PROGRESS IN RECRUITER BASE AND PACKAGE:
The recruiters list is growing every year as the performance of our alumni in the industries are highly rated.
|
Description/Year |
2015-16 |
2016-17 |
2017-18 |
2018-19 |
|
# of Companies visited |
143 |
195 |
273 |
361 |
|
#. of Core Companies |
32 |
30 |
46 |
66 |
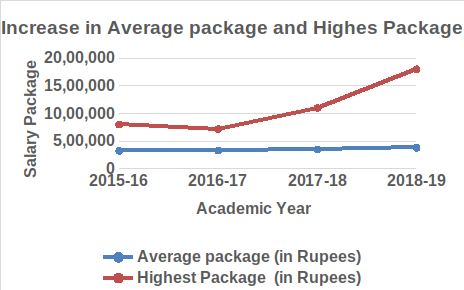
The improvised Employability Skill Development programs helped us to increase the average package also apart from the sharp increase in the highest package offered. The below is the statistics of last four years:
|
Description/Year |
2015-16 |
2016-17 |
2017-18 |
2018-19 |
|
Average package (in Rupees) |
3,25,000 |
3,30,000 |
3,50,000 |
3,80,000 |
|
Highest Package (in Rupees) |
6,60,000 |
7,20,000 |
11,00,000 |
18,00,000 |